Second experiment: Replication Study
Background: Adaptive user interfaces have the advantage of being able to dynamically change their aspect and/or behaviour depending on the characteristics of the context of use, i.e. to improve user experience. User experience is an important quality factor that has been primarily evaluated with classical measures (e.g. effectiveness, efficiency, satisfaction), but to a lesser extent with physiological measures, such as emotion recognition, skin response, or brain activity. Aim: In a previous exploratory experiment involving users with different profiles and a wide range of ages, we analysed user experience in terms of cognitive load, engagement, attraction and memorisation when employing twenty graphical adaptive menus through the use of an Electroencephalogram (EEG) device. The results indicated that therewere statistically significant differences for these four variables. However, we considered that it was necessary to confirm or reject these findings using a more homogeneous group of users. Method: We conducted a strict internal replication study with 40 participants. We also investigated the potential correlation between EEG signals and the participants’ user experience ratings, such as their preferences. Results: The results of this experiment confirm that there are statistically significant differences between the EEG variables when the participants interact with the different adaptive menus. Moreover, there is a high correlation among the participants’ user experience ratings and the EEG signals, and a trend regarding performance has emerged from our analysis. Conclusions: These findings suggest that EEG signals could be used to evaluate user experience. With regard to the menus studied, our results suggest that graphical menus with different structures and font types produce more differences in users’ brain responses, while menus which use colours produce more similarities in users’ brain responses. Several insights with which to improve users’ experience of graphical adaptive menus are outlined.
Instrumentation
Device
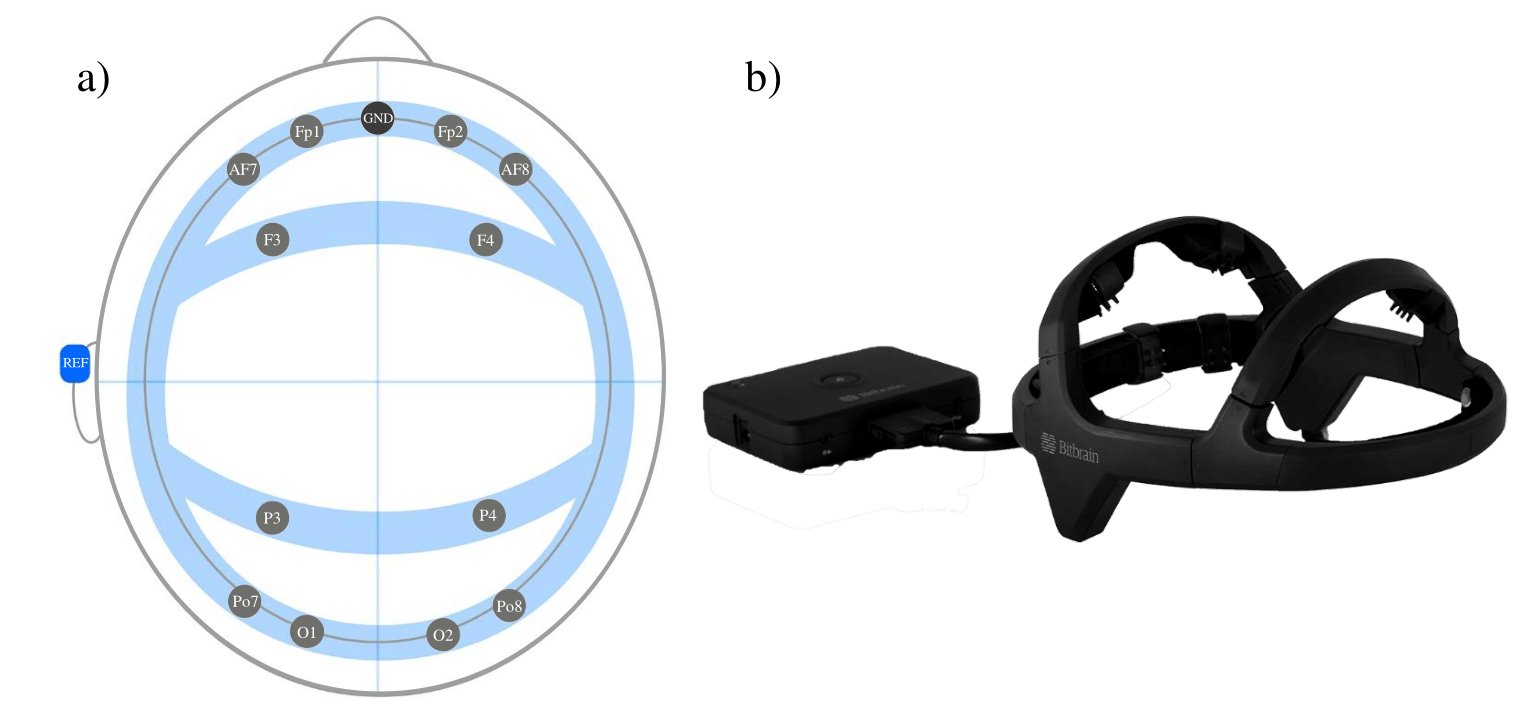
We used Bitbrain’s Diadem headset. The following image illustrates the headset and its electrode placement.
Slides
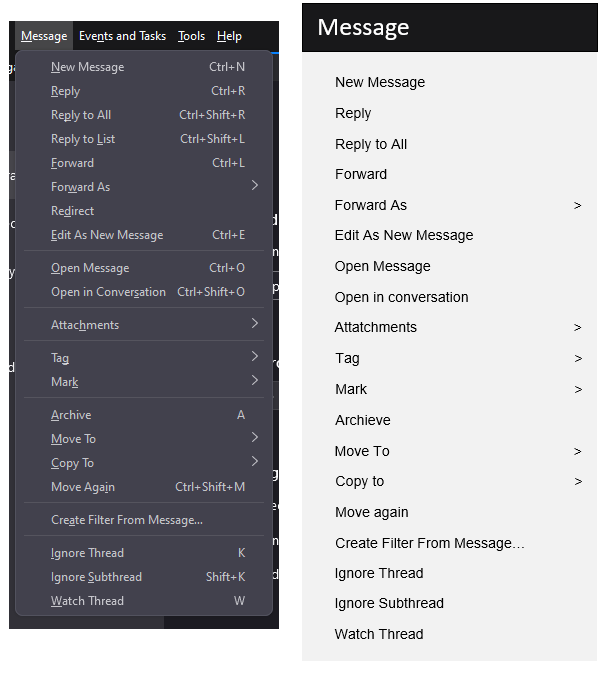
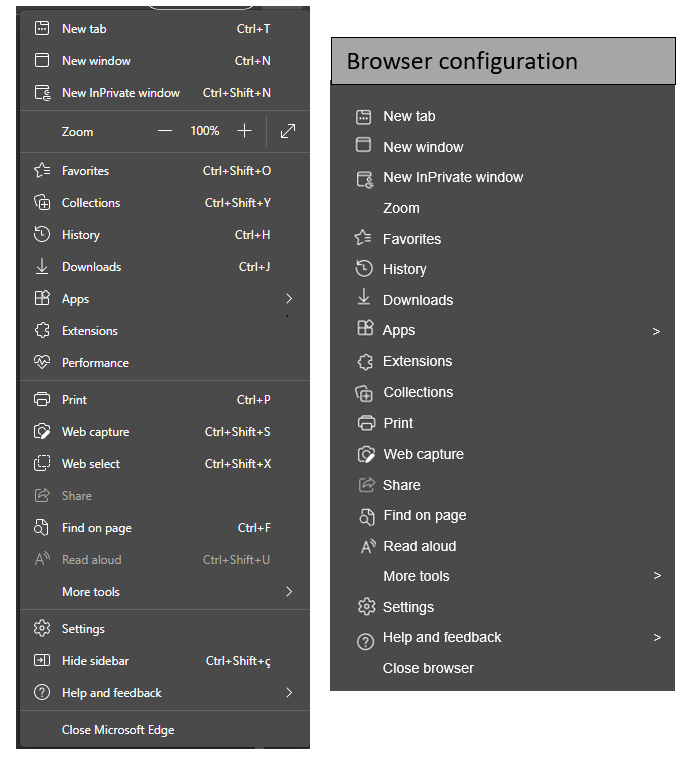
We represented the different graphical adaptive menus using an interactive slide presentation. Our menu representationswere based on two different domains: a mail manager software and a web browser.
Questionnaires
The UEQ-S consists of eight items that are grouped into two scales (hedonic quality and pragmatic quality). As shown in the following table, each item has a positive and a negative value that must be rated from 1 (being the negative value of the item) to 7 (being the positive value of the item), and 4 being the neutral value.
| Scale | ID | Negative Value | Positive Value |
|---|---|---|---|
| Pragmatic Quality | I1 I2 I3 I4 |
obstructive complicated inefficient confusing |
supportive easy efficient clear |
| Hedonic Quality | I5 I6 I7 I8 |
boring not interesting conventional usual |
exciting interesting inventive leading edge |
Downloadable material
For this experiment we used PowerPoint slides. We used a template and then generaded more pptx for each participants using a different menu order of use. This template can be downloaded here.
After the experimental sesion, participants had to fill a questionnaire, which can be downlaoded here.
Data
This section is divided in 2 parts:
- Calculated_data: In regards to the DTW distances and all calculations for the emotion and perception-based variables.
- Questionnaires: The answers of every questionnaire
First, we obtained the metrics from SennsCloud for each participant. Then we computed the DTW distance. The results can be downloaded here
After each session, participants filled in the questionnaires. The participants’ answers can be dowloaded here.
Results
The results of the descriptive analysis performed over the emotion-based variables can be found here.
The results of the questionnaires analysis performed for each menu: